
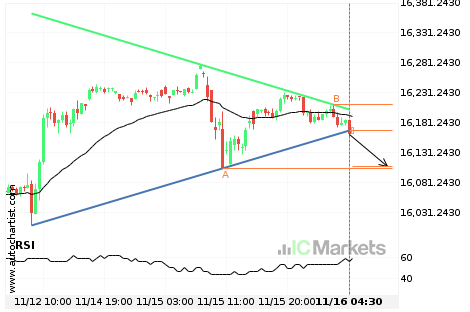
Possibility of big movement expected on US Tech 100 Index
US Tech 100 Index has broken through a support line of a Triangle and suggests a possible movement to 16108.2798 within the next 13 hours. It has tested this line in the past, so one should probably wait for a confirmation of this breakout before taking action. If the breakout doesn’t confirm, we could see […]
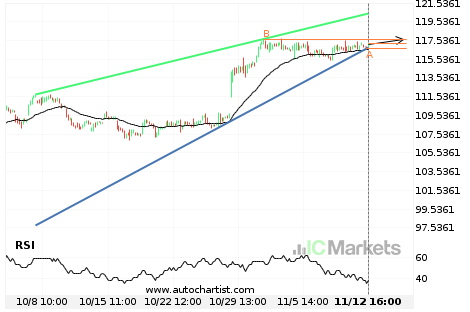
Will AbbVie have enough momentum to break resistance?
AbbVie is heading towards the resistance line of a Rising Wedge and could reach this point within the next 3 days. It has tested this line numerous times in the past, and this time could be no different from the past, ending in a rebound instead of a breakout. If the breakout doesn’t happen, we […]
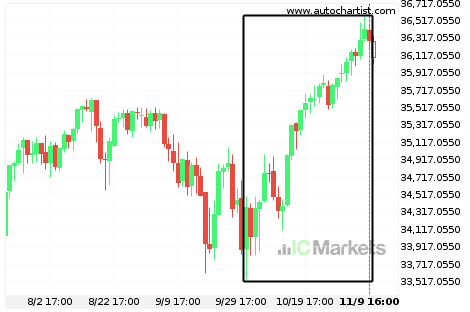
What’s going on with US Wall Street 30 Index?
Those of you that are trend followers are probably eagerly watching US Wall Street 30 Index to see if its latest 5.58% move continues. If not, the mean-reversion people out there will be delighted with this exceptionally large 41 days move.
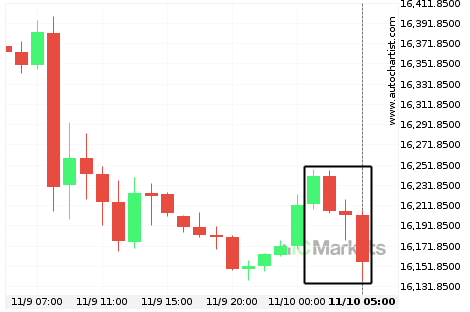
US Tech 100 Index experienced an exceptionally large movement
For those of you that don’t believe in trends, this may be an opportunity to take advantage of an exceptional 0.52% move on US Tech 100 Index. The movement has happened over the last 4 hours. For those trend followers among you, you may think about riding this possible trend.

US Small Cap 2000 Index – getting close to resistance of a Channel Up
US Small Cap 2000 Index is moving towards a resistance line. Because we have seen it retrace from this line before, we could see either a break through this line, or a rebound back to current levels. It has touched this line numerous times in the last 8 days and may test it again within […]
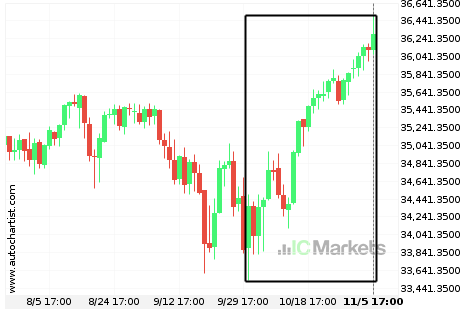
Where is US Wall Street 30 Index moving to?
A movement of 5.61% over 37 days on US Wall Street 30 Index doesn’t go unnoticed. You may start considering where it’s heading next, a continuation of the current upward trend, or a reversal in the previous direction.
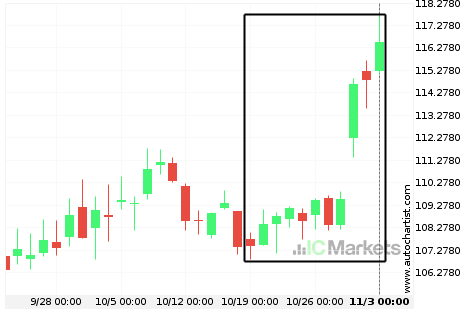
AbbVie experienced an exceptionally large movement
For those of you that don’t believe in trends, this may be an opportunity to take advantage of an exceptional 9.42% move on AbbVie. The movement has happened over the last 17 days. For those trend followers among you, you may think about riding this possible trend.
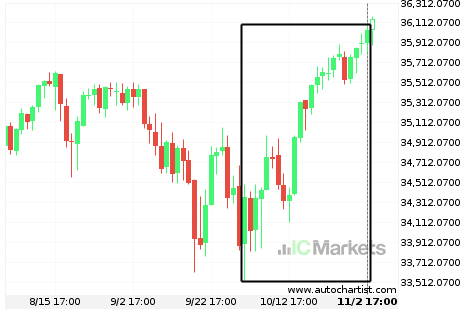
Where is US Wall Street 30 Index moving to?
A movement of 4.87% over 34 days on US Wall Street 30 Index doesn’t go unnoticed. You may start considering where it’s heading next, a continuation of the current upward trend, or a reversal in the previous direction.
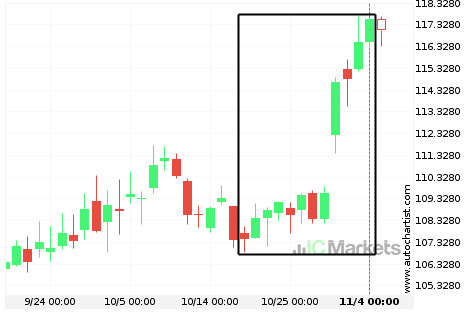
AbbVie is on its way up
AbbVie has experienced an exceptionally large movement higher by 8.45% from 107.75 to 116.53 in the last 16 days.

Tesla Inc. is on its way up
Tesla Inc. has experienced an exceptionally large movement higher by 65.62% from 734.13 to 1,209.48 in the last 44 days.